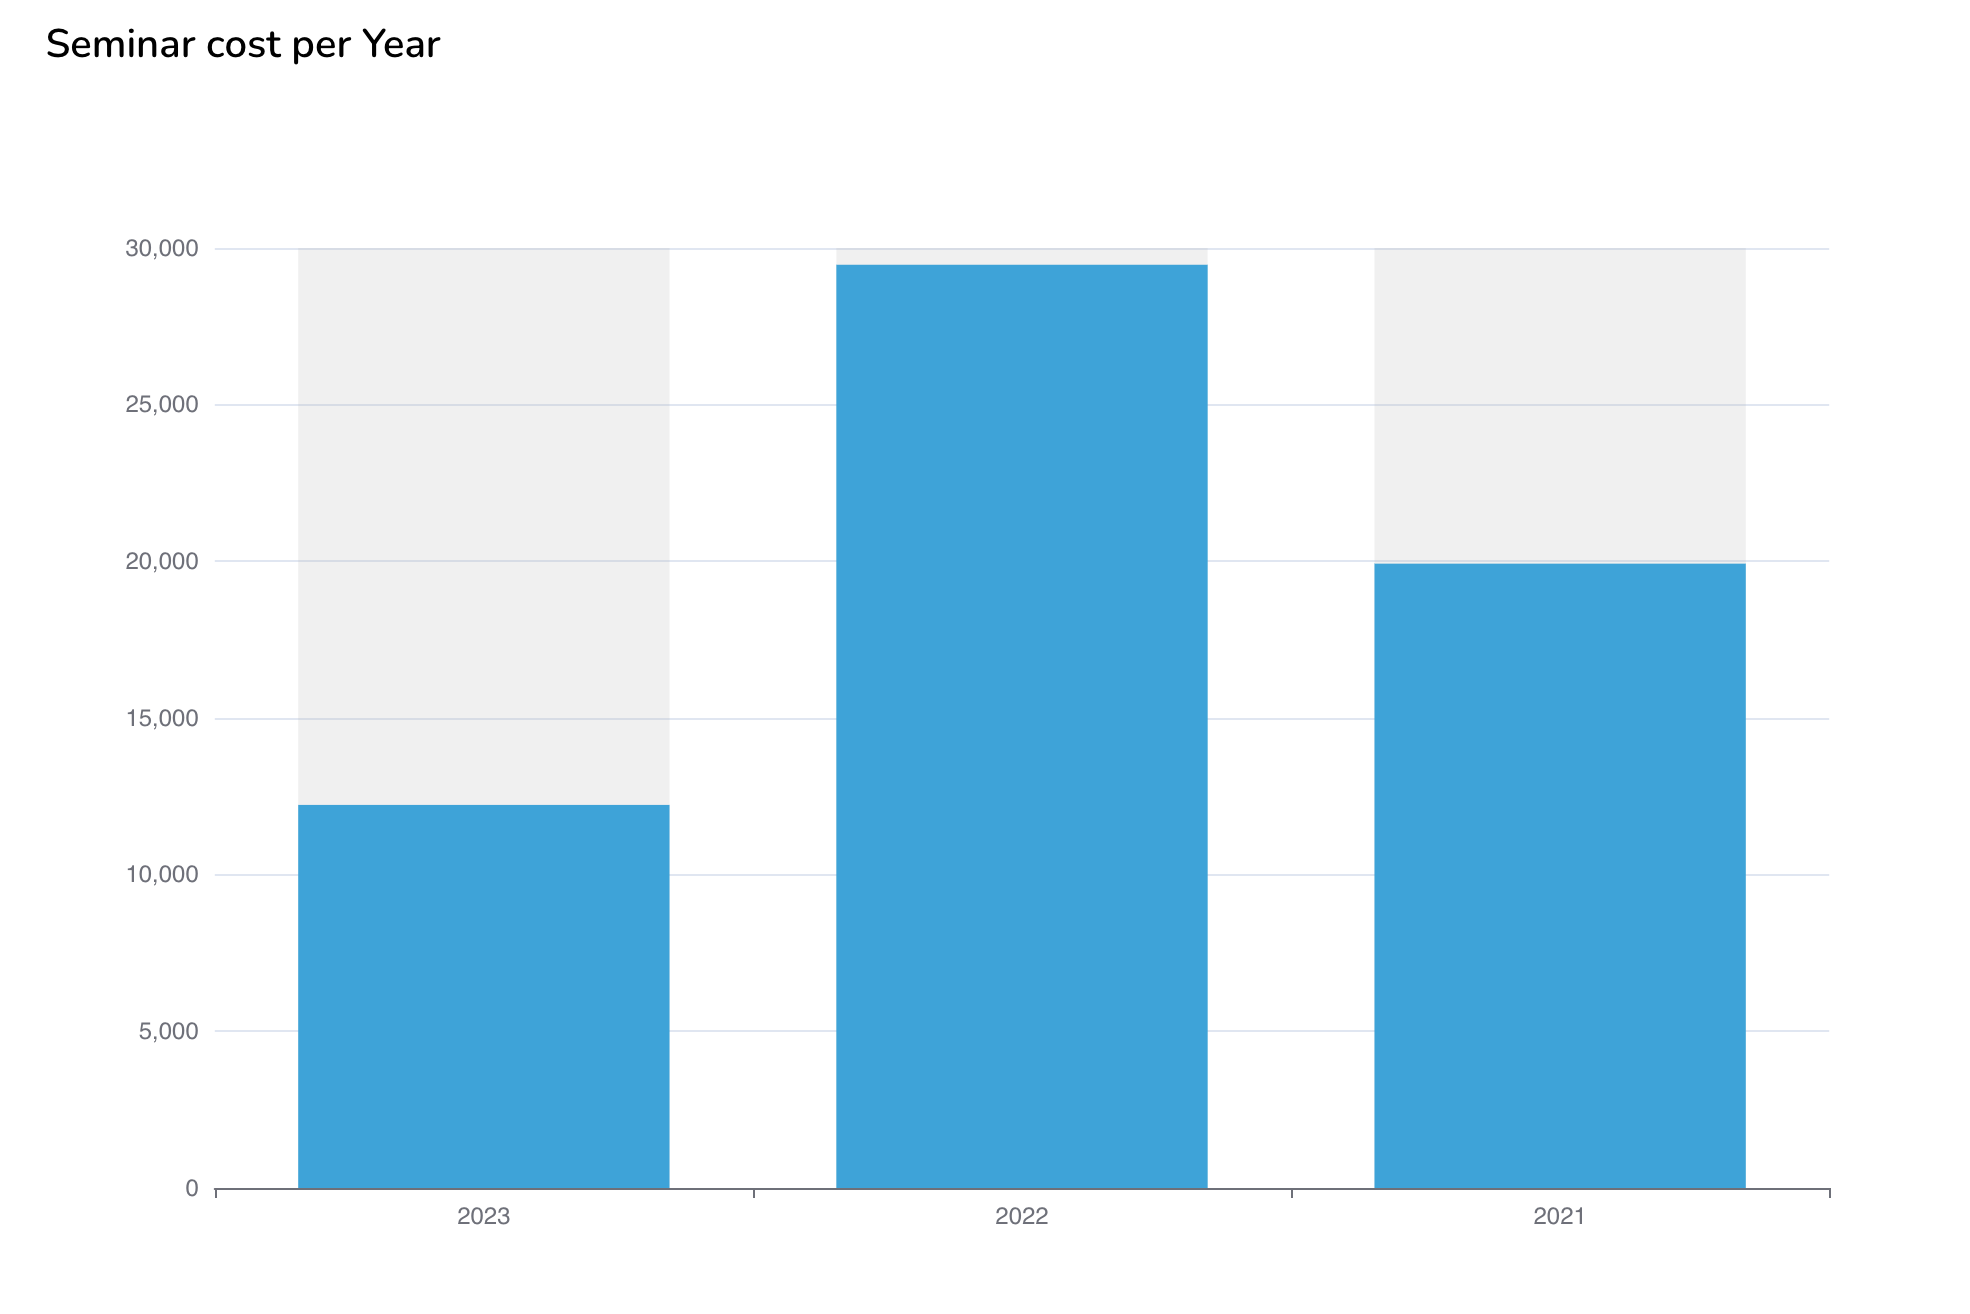
Prepare data for eCharts with DataSeries in Laravel
February 2nd, 2023
This is an example from eCharts documentation of what kind of data we'll need in our view component:
1const option = ref({ 2 xAxis: { 3 type: 'category', 4 data: ['Mon', 'Tue', 'Wed', 'Thu', 'Fri', 'Sat', 'Sun'] 5 }, 6 yAxis: { 7 type: 'value' 8 }, 9 series: [10 {11 data: [120, 200, 150, 80, 70, 110, 130],12 type: 'bar',13 showBackground: true,14 backgroundStyle: {15 color: 'rgba(180, 180, 180, 0.2)'16 }17 }18 ]19 });What we'll need:
year => total price of all seminars
From there it is easy to get years array and prices array that we need
How can we get that from our database:
get all seminars grouped by year
get users_count and price for each seminar:
withCount('users')),select('price')total price for each seminar for each year: users_count * price
total price of all seminars for each year: sum of users_count * price
1. controller: SeminarController
1 2class SeminarController extends Controller 3{ 4 public function pricePerYearWithDataSeries() 5 { 6 // get data from db: seminars grouped by year => price of all seminars attended 7 $seminarsGroupedByYear = Seminar::all()->groupBy('year'); 8 9 // pass data to view:10 // on xAxis data: $years, series: $prices11 return inertia('Seminars/PricePerYearDataSeries');12 }13}We don't have year column on our seminars table, but we have date.
1Schema::create('seminars', function (Blueprint $table) {2 $table->id();3 $table->string('title');4 $table->integer('price');5 $table->date('date'); 6 $table->integer('credits');7 $table->foreignId('organiser_id');8 $table->timestamps();9 });We need to get year from date column:
Date is Carbon Object, so we can get year
$seminar->date->yearWe defined that in Seminar.php model with
protected $dates = ['date'];select only columns id, price, date
1$seminarsGroupedByYear = Seminar::query()2 ->select('id', 'price', 'date')3 ->get()4 ->groupBy(fn($seminar) => $seminar->date->year);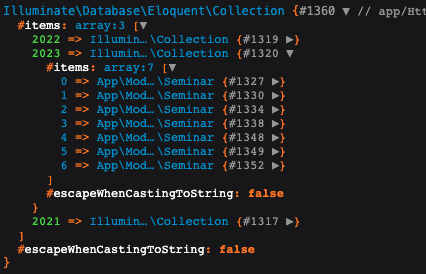
Add orderBy('date', 'dsc') or latest('date')
1$seminarsGroupedByYear = Seminar::query()2 ->select('id', 'price', 'date')3 ->latest('date')4 ->get()5 ->groupBy(fn($seminar) => $seminar->date->year);We'll also need users_count to calculate price of all seminars in year.
1 $seminarsGroupedByYear = Seminar::query()2 ->select('id', 'price', 'date')3 ->withCount('users')4 ->latest('date')5 ->get()6 ->groupBy(fn($seminar) => $seminar->date->year);7 8dd($seminarsGrouedByYear->toArray()) // easier to see what we have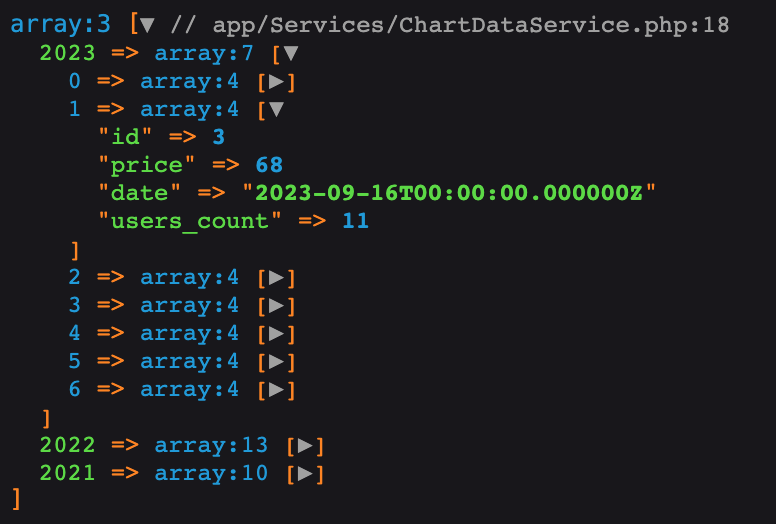
We need to do:
calculate price of all seminars each year:
users_count * seminar price is the price for each seminar -> then sum of all that
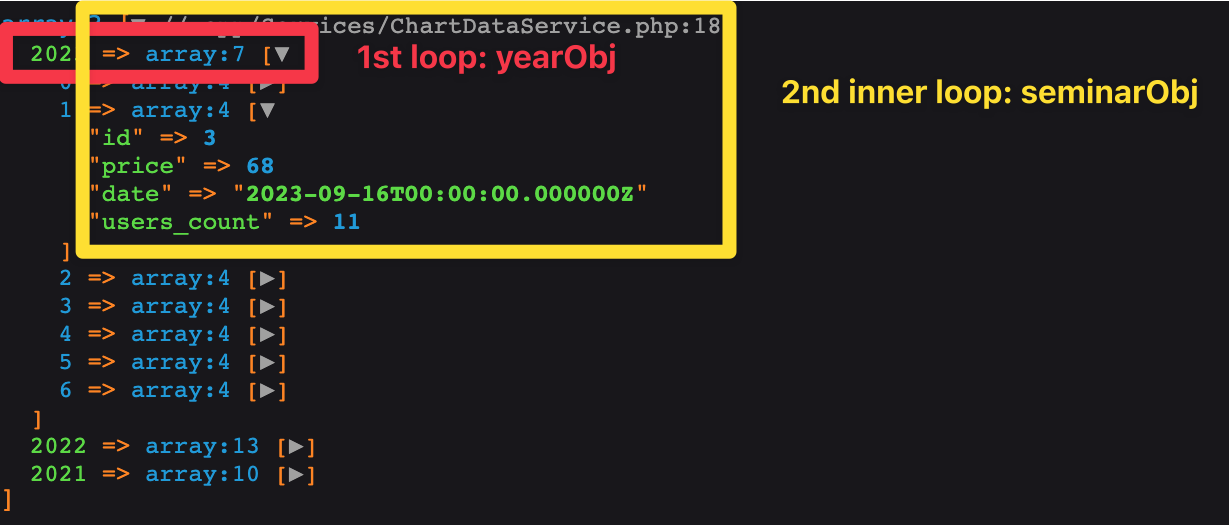
1$seminarsByYearCost = $seminarsGroupedByYear->mapWithKeys(2 fn($yearObj, $year) => [3 $year => $yearObj->sum(fn($seminarObj) => $seminarObj->price * $seminarObj->users_count4 ])5);6 7// [year => sum of seminarObj price * seminarObj users_count]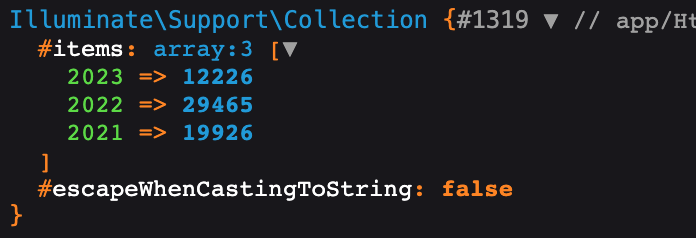
1 2class SeminarController extends Controller 3{ 4 public function pricePerYearWithDataSeries() 5 { 6 // get data from db: seminars grouped by year => price of all seminars attended 7 8 // 1. number of users attended each seminar that year => seminar_title => users_count, price 9 $seminarsGroupedByYear = Seminar::query()10 ->select('id', 'price', 'date')11 ->withCount('users')12 ->latest('date')13 ->get()14 ->groupBy(fn($seminar) => $seminar->date->year);15 16 // 2. get array: year => sum(seminar price * seminar users_count)17 // mapWithKeys(fn($value, $key) => [$key => $total_price]) 1st loop through yearObj, the inner loop through seminarObj18 // total_price = sum of users_count * price of seminar19 $seminarsByYearCost = $seminarsGroupedByYear->mapWithKeys(fn($yearObj, $year) => [20 $year => $yearObj->sum(fn($seminarObj) => $seminarObj->price * $seminarObj->users_count)21 ] );22 23 24 // years are keys of collection $seminarsByYearCost25 $years = $seminarsByYearCost->keys();26 27 // prices are values of collection $seminarsByYearCost28 $prices = $seminarsByYearCost->values();29 30 31 // pass data to view:32 //on xAxis data: $years, series: $prices33 return inertia('Seminars/PricePerYearDataSeries', [34 'years' => $years,35 'prices' => $prices36 ]);37 }38}2. view: PricePerYearDataSeries.vue
accept props
1<template> 2 <AuthenticatedLayout> 3 <h2 class="px-4 py-7 text-xl font-semibold">Seminar cost per Year</h2> 4 <v-chart class="chart h-[600px] w-full" :option="option" autoresize /> 5 </AuthenticatedLayout> 6</template> 7 8<script setup> 9import AuthenticatedLayout from '@/Layouts/AuthenticatedLayout.vue';10import { use } from 'echarts/core';11import { CanvasRenderer } from 'echarts/renderers';12import { BarChart } from 'echarts/charts';13import { TitleComponent, TooltipComponent, LegendComponent, GridComponent } from 'echarts/components';14import VChart, { THEME_KEY } from 'vue-echarts';15import { ref, provide } from 'vue';16 17use([ CanvasRenderer, BarChart, TitleComponent, TooltipComponent, LegendComponent, GridComponent]);18 19provide(THEME_KEY, 'light');20 21const props = defineProps({ 22 years: Array,23 prices: Array24})25 26const option = ref({27 xAxis: {28 type: 'category',29 data: props.years 30 },31 yAxis: {32 type: 'value'33 },34 series: [35 {36 data: props.prices, 37 type: 'bar',38 showBackground: true,39 backgroundStyle: {40 color: 'rgba(180, 180, 180, 0.2)'41 }42 }43 ]44});45 46</script>3. move logic from controller to ChartDataService
1class ChartDataService 2{ 3 4 public static function prepareDataGroupedByYear() 5 { 6 // get data from db: seminars grouped by year => price of all seminars attended 7 8 // number of users attended each seminar that year => seminar_title => users_count 9 $seminarsGroupedByYear = Seminar::query()10 ->select('id', 'price', 'date')11 ->withCount('users')12 ->latest('date')13 ->get()14 ->groupBy(fn($seminar) => $seminar->date->year);15 16 // year => sum(seminar price * seminar users_count) // 2023 => 67517 // mapWithKeys(fn($value, $key) => [$key => $total_price]) 1st loop through yearObj, the inner loop through seminarObj18 // total_price = sum of users_count * price of seminar19 20 $seminarsByYearCost = $seminarsGroupedByYear->mapWithKeys(fn($yearObj, $year) => [21 $year => $yearObj->sum(fn($seminarObj) => $seminarObj->price * $seminarObj->users_count)22 ] );23 24 // dd($seminarsByYearCost);25 26 return $seminarsByYearCost;27 }28 29 30} 1class SeminarController extends Controller 2{ 3 public function pricePerYearWithDataSeries() 4 { 5 6 $seminarsByYearCost = ChartDataService::prepareDataGroupedByYear(); 7 8 // years are keys of collection 9 $years = $seminarsByYearCost->keys();10 11 // prices are values of collection12 $prices = $seminarsByYearCost->values();13 14 15 // pass data to view:16 //on xAxis data: $years, series: $prices17 return inertia('Seminars/PricePerYearDataSeries', [18 'years' => $years,19 'prices' => $prices20 ]);21 }22}4. Final result
